Start debugging in Neovim
Table of Contents
There are a few choices to us in Neovim, I went down the path of the DAP (Debug Adapter Protocol) and so picked nvim-dap and nvim-dap-ui
Setup #
I’ll go through what I think are the important parts of the setup, you should read the docs of the plugins though as there are many options and I might not have picked the best ones for you.
Here’s my debugging section from my plugins.lua config file:
     -- Debugging
    use 'nvim-lua/plenary.nvim'
    use {
        "rcarriga/nvim-dap-ui",
        requires = "mfussenegger/nvim-dap"
    }
    use 'simrat39/rust-tools.nvim'
    use 'nvim-telescope/telescope-dap.nvim'
Rust-tools debug config #
rust-tools specific config - lots of settings stripped as we just want to focus on the ones important for debugging
-- setup debugger based on vscode plugin - if this breaks chances are the plugin got updated so alter the path to match on next line...
local extension_path = vim.env.HOME .. '/.vscode-oss/extensions/vadimcn.vscode-lldb-1.8.1-universal/'
local codelldb_path = extension_path .. 'adapter/codelldb'
local liblldb_path = extension_path .. 'lldb/lib/liblldb.so'

local rt = require('rust-tools')

local opts = {
    tools = {
        ...
    },
    server = {
        ...
    },
    dap = {
        adapter = require('rust-tools.dap').get_codelldb_adapter(codelldb_path, liblldb_path)
    },
}
rt.setup(opts)
The first 3 lines setting up the path to Visual Studio Code OSS’s lldb and the use of it within the opts.dap object
If you want to see the complete files, look at my Github repo, the
luafolder has the main files, whereaspluginhas plugin specific settings.
The lldb you get by default is capable of debugging rust but it might provide you with some surprising outputs - values don’t conform to rust types. As an example, here is what a Result variable looks like without the VSCode lldb mod:
Locals:
 ▸ result core::result::Result<> = core::result::Result<> @ 0x7ffff7c8d608
You can tell it’s a Result, but you can neither see the types or the value, what actually is @ 0x7ffff7c8d608? Well, it’s a memory address, but rather than putting on our detective hat and snooping through memory, I’d prefer the UII just show me the type and value immediately.
Now, let’s see the same view but with the custom lldb from the above config example:
Local:
 ▸ result core::result::Result<u64, alloc::string::String>::Err = Err("Overflow detected")
Now we can see the result is either a u64 or a String error, and the value is an error that states there was an “Overflow detected”.
Start a debugging session #
Now we have the config, we need to actually use it. You could enter commands to add breakpoints and start debugging, however I prefer shortcuts and so I use <space> bb for toggling breakpoints via the nvim-dap plugin:
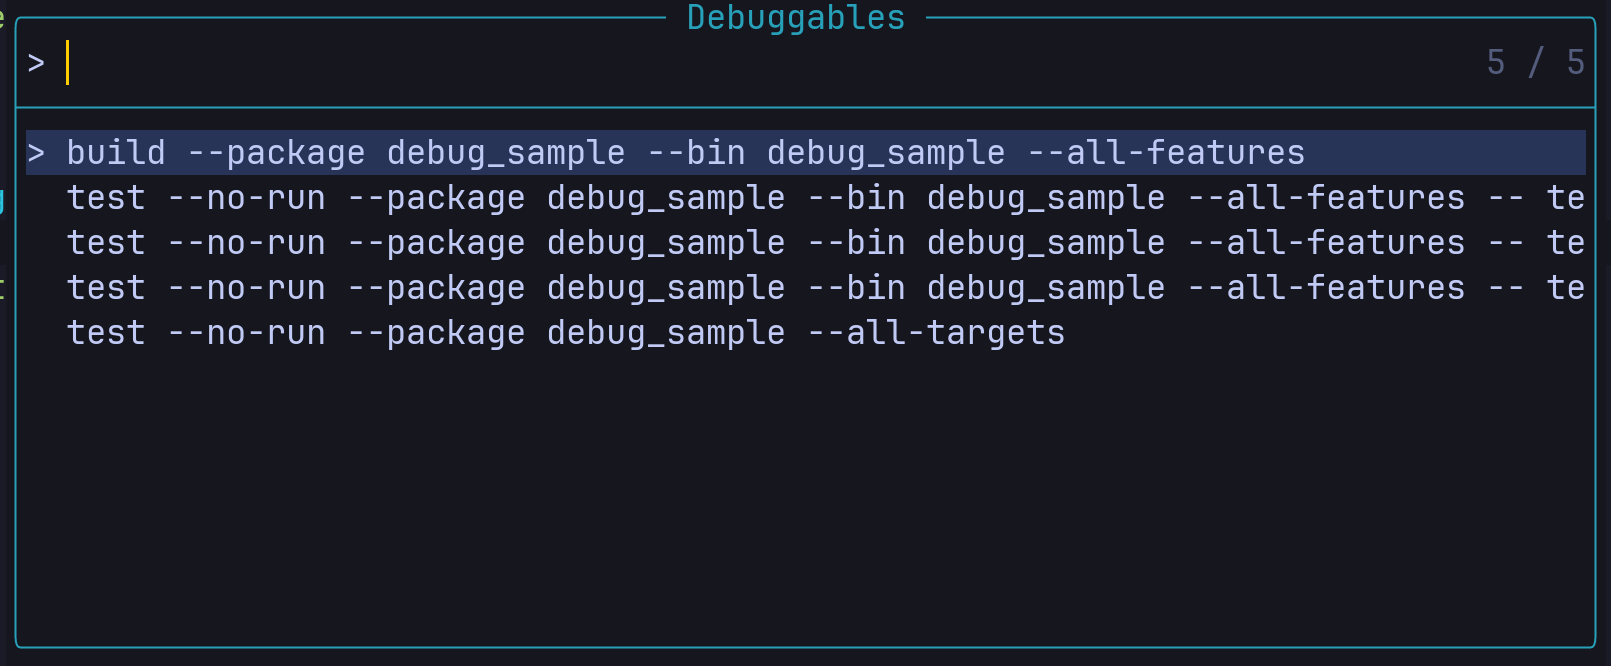
map("n", "<leader>bb", "<Cmd>lua require'dap'.toggle_breakpoint()<CR>", describeOptions("Toggle Breakpoint", sOpts))For starting a debug session, <space>rd allows me to pick what I want to run via the rust-tools plugin
buf_set_keymap('n', '<leader>rd', '<cmd>:RustDebuggables<cr>', opts)Here are the options I get from RustDebuggables when run against a simple rust binary with 2 unit tests (we’ll see that code very soon):
Simple rust program to debug #
Just to try out the tools before using it in your project to verify things are working in the simplest case, here is a main.rs file that has a couple of functions and some units tests, this is going to allow you to debug the code and even unit tests.
fn main() {
    println!("Good example...");
    let good = addition(4, 5);
    output_result(good);
    println!("Bad example...");
    let bad = addition(u64::MAX, 1);
    output_result(bad);
}

fn output_result(res: Result<u64, String>) {
    match res {
        Ok(result) => println!("The result was {result}"),
        Err(message) => println!("An error occured, {message}"),
    }
}

fn addition(a: u64, b: u64) -> Result<u64, String> {
    match u64::MAX - a < b {
        true => Err(String::from("Overflow detected")),
        false => Ok(a + b),
    }
}

#[cfg(test)]
mod tests {
    use super::*;

    #[test]
    fn addition_basic() {
        let result = addition(2, 8);
        assert_eq!(Ok(10), result);
    }

    #[test]
    fn addition_bad() {
        let result = addition(u64::MAX, 1);
        assert_eq!(Err(String::from("Overflow detected")), result);
    }
}
I’ve put the variable assignments in the unit tests so that we can put breakpoints on the asserts and inspect the result of the call to addition before the assert is executed.
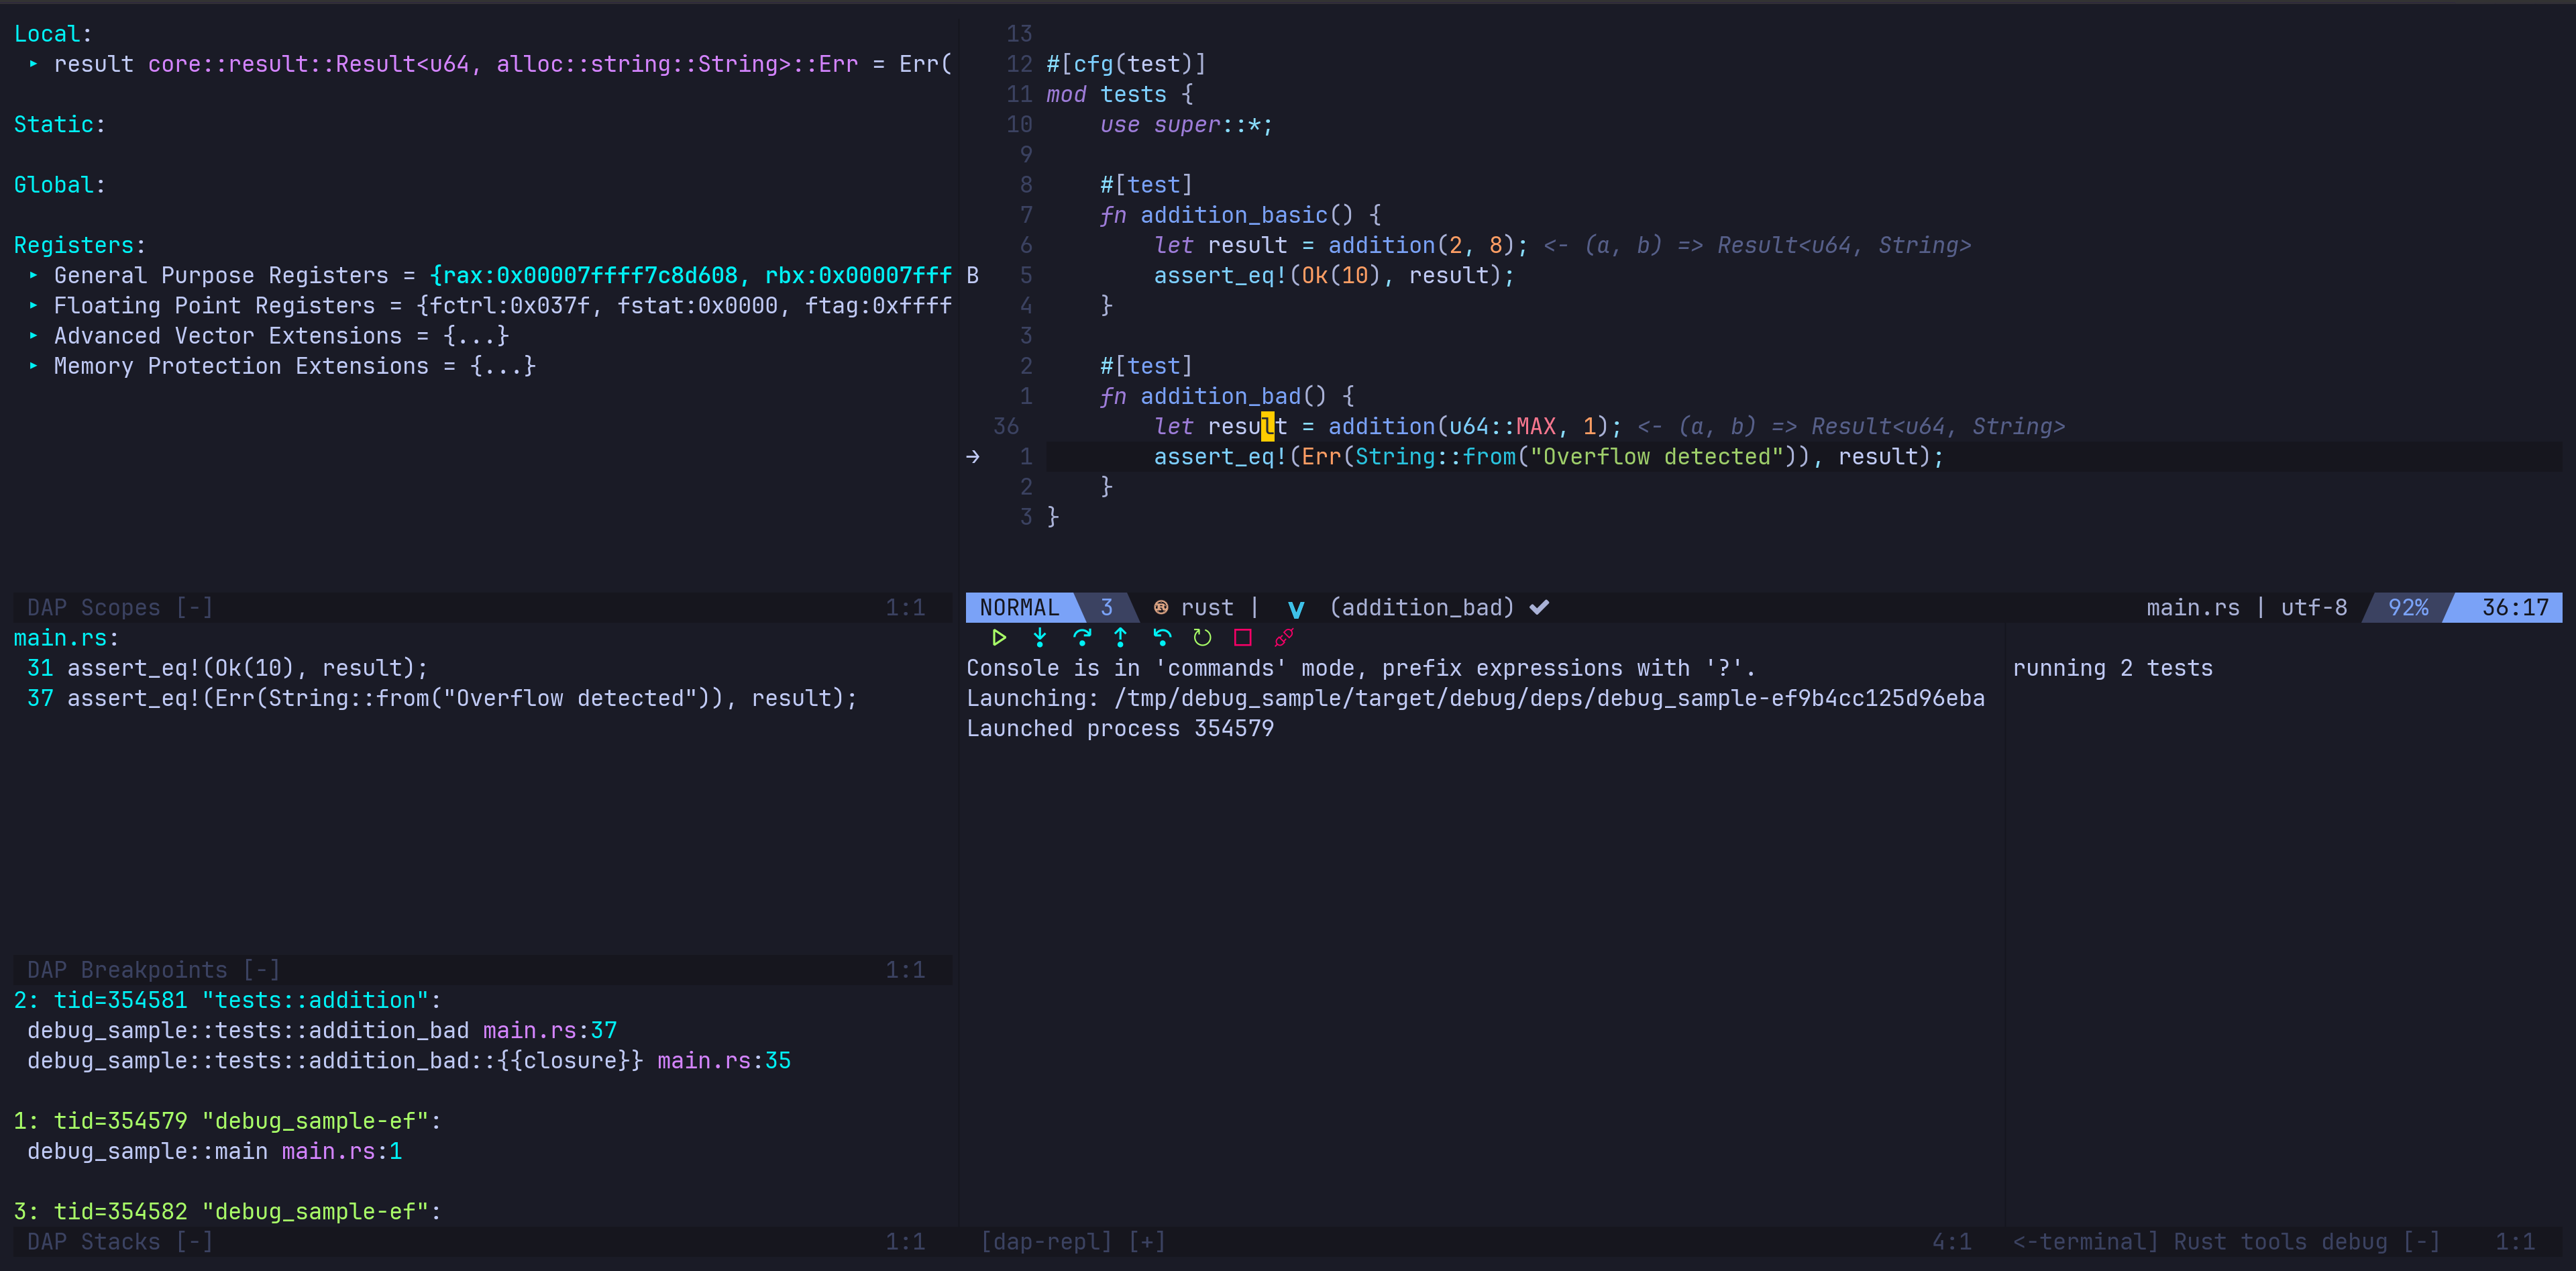
The above screenshot shows the debugger in action, with the current line of execution on the assert in the addition_bad unit test. The Scopes window is interactive, you can move your cursor over to it and, with my config at least, hit enter on any line that has the ▸ symbol and it will expand to show more detail, very useful for wrapper types and collections.
I find it useful to have a shortcut to the nvim-dap-ui’s eval function, which allows you to put your cursor over any part of the code and see what it evaluates too, here is what is looks like:

This seems to be limited to variables that are in scope within the current stack, this might make you think “I can already see that in the scopes window” and you’d be right, but that means you need to have the DAP UI toggled on, which usually takes up a large chunk of screen real estate. The UI and the debugging state are not coupled, you can start debugging without the UI showing, you can toggle the UI on and off without upsetting the debugging session. Basically, DAP UI is just a view. So if you want to use all the screen to see the code, the evaluate suddenly becomes much more useful as you can just quickly run the eval, see what the value is and then keep going.
Once you get accustomed to debugging, you’ll want to switch over to shortcuts rather than clicking buttons to step through the code. I am used to Microsoft’s tooling as I was a C# developer for a very long time, and so the Visual Studio shortcuts (F5 and F11 you two are my goto keys). If you are interested but don’t want to go search my Neovim config for them, these are my debugging related shortcuts:
map("n", "<F5>", "<Cmd>lua require'dap'.continue()<CR>", sOpts)
map("n", "<F10>", "<Cmd>lua require'dap'.step_over()<CR>", sOpts)
map("n", "<F11>", "<Cmd>lua require'dap'.step_into()<CR>", sOpts)
map("n", "<F12>", "<Cmd>lua require'dap'.step_out()<CR>", sOpts)
map("n", "<leader>b<F5>", "<Cmd>lua require'dap'.continue()<CR>", describeOptions("Continue", sOpts)) -- these are repeated, meant as hints for whichkey.
map("n", "<leader>b<F10>", "<Cmd>lua require'dap'.step_over()<CR>", describeOptions("Step Over", sOpts))
map("n", "<leader>b<F11>", "<Cmd>lua require'dap'.step_into()<CR>", describeOptions("Step Into", sOpts))
map("n", "<leader>b<F12>", "<Cmd>lua require'dap'.step_out()<CR>", describeOptions("Step Out", sOpts))
map("n", "<leader>bb", "<Cmd>lua require'dap'.toggle_breakpoint()<CR>", describeOptions("Toggle Breakpoint", sOpts))
map("n", "<leader>bB", "<Cmd>lua require'dap'.set_breakpoint(vim.fn.input('Breakpoint condition: '))<CR>",
    describeOptions("Conditional Breakpoint", sOpts))
map("n", "<leader>bL", "<Cmd>lua require'dap'.set_breakpoint(nil, nil, vim.fn.input('Log point message: '))<CR>",
    describeOptions("Log Breakpoint", sOpts))
map("n", "<leader>br", "<Cmd>lua require'dap'.repl.open()<CR>", describeOptions("REPL", sOpts))
map("n", "<leader>bl", "<Cmd>lua require'dap'.run_last()<CR>", describeOptions("Run Last Config", sOpts))
map("n", "<leader>bT", "<Cmd>lua require'dap'.terminate()<CR>", describeOptions("Terminate", sOpts))
map("n", "<leader>bD", "<Cmd>lua require'dap'.disconnect()<CR> require'dap'.close()<CR>",
    describeOptions("Disconnect & Close", sOpts))

map("n", "<leader>bt", "<Cmd>lua require'dapui'.toggle()<CR>", describeOptions("Toggle UI", sOpts))
map("n", "<leader>be", "<Cmd>lua require'dapui'.eval()<CR>", describeOptions("Evaluate under cursor", sOpts))
I’ve grown used to
<space>bbeing my entry into debugging, and I’ve added the F keys for stepping to that group/chord just so I can remind myself if I hit<space>bthen stop and letWhichKeykick in to show me all my shortcuts. As time goes on the need for this wanes but as I have ever so slightly moved away from Visual Studio defaults, it’s nice to remind me that step out was mapped to F12 rather than Shift and F11.